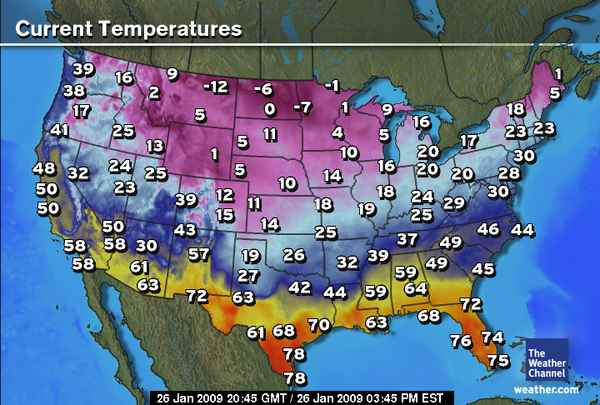
Isolines rock at depicting continuous data. From temperature maps on your local news station, to topographic maps, isolines are your friend in showing continuous data over a spatial plane. The above map forgoes the isoline boundaries, and instead the cartographer made the choice to simply allow the colors to flow from the low values to high values. It is important to note that the above map does not have set intervals for labeling it's isoline values, and since this is a temperature map for non-research purposes this is not terribly surprising -- most temperature maps produced at this scale are labeling temperature at the rough location of major cities (New York City, Washington D.C., Denver, CO, etc).
No comments:
Post a Comment